The famous bidomain model comes from the homogeneization of the quasi-static electric potential problem at the cell scale, where the intra- and extra-cellular potentials are defined. Assuming that the myocardium is locally constituted of a periodic pattern of cardiac cells, the bidomain problem reads:
This formulation is what is implemented in CEPS, even if it could be written in a more simple way.
# Bidomain model:
# unknown index 0 represents the transmembrane voltage
# unknown index 1 represents the extracellular potential
problem type : bidomain
#-----------------
# Output controls
#-----------------
# Output name
output file name : ./results/bidomainRL2
# Output every 0.5ms
snapshot time : 0.5
# Data used to generate the activation time map. Values are
# - Unknown index
# - AP detection threshold (mV)
# - Minimum voltage used for peak detection (mV)
# - AP duration percentage
activation time data : 0 -20 -40 0.75
# Probe points: values of the unknowns at those points*
# along time will be written in a separate file
# (*at closest point in given mesh to be exact)
probe points : 2.68655 -15.8401 20.9223 , 1.34332 -16.1237 19.8474
#-----------------
# Simulation time
#-----------------
# Times are given in milliseconds
PDE start time : 0.0
PDE end time : 25
#----------
# Geometry
#----------
# Meshes
2d mesh : ./meshes/atriaSurfacic
# The given mesh has units of cm, which is also CEPS length unit.
# So there is no need for scaling.
# geometry scale : 1
# Partitioning method can be
# - PTScotchNode
#--------
# Tissue
#--------
# Surface to volume ratio, in cm-1
Am : CONSTANT 200.0
# Surfacic membrane capacitance, in muF per cm2.
# If commented, Cm from the ionic model is used
# Cm : CONSTANT 1.0
# Conductivity, in mS per cm
intracellular conductivity : CONSTANT 1.2 0.4 0.4
extracellular conductivity : CONSTANT 1.2 0.4 0.4
#-------------
# Ionic model
#-------------
# Format: unknownIndex ionicModelName <regionAttributes>
# Here we use the Beeler-Reuter model everywhere
# for transmembrane voltage (component 0)
# No ionic model on extracellular potential
#-------------
# Stimulation
#-------------
# TIME options define the evolution of time of the stimulation.
# Here a one-time stim with C4 continuous profile that lasts 2 ms
# SPACE options define where the stimulation is applied.
# Here as well a C4 bell shaped stimulation, centered at 0.5 0.5 0 with
# 0.05 diameter
# Amplitude is in muA per cm2
stimulation: TIME PROFILE
C4 START 0.04 DURATION 2. \
SPACE PROFILE
C4 CENTER 0.5 0.5 0. DIAMETER 0.05 AMPLITUDE 5000
#----------------
# solver options
#----------------
# Only FE 1 available for now
spatial discretization : FE 1
# Time scheme for PDE solving
PDE solver : SBDF 2
PDE time step : 0.05
# Linear solver options
absolute tolerance : 1.E-12
relative tolerance : 1.E-12
solver type : GMRES
# Ionic solver. Here Rush Larsen of order 2.
ionic model solver : RL 2
@ PTScotchNode
GeomNode SCOTCH partitioning using primal graph.
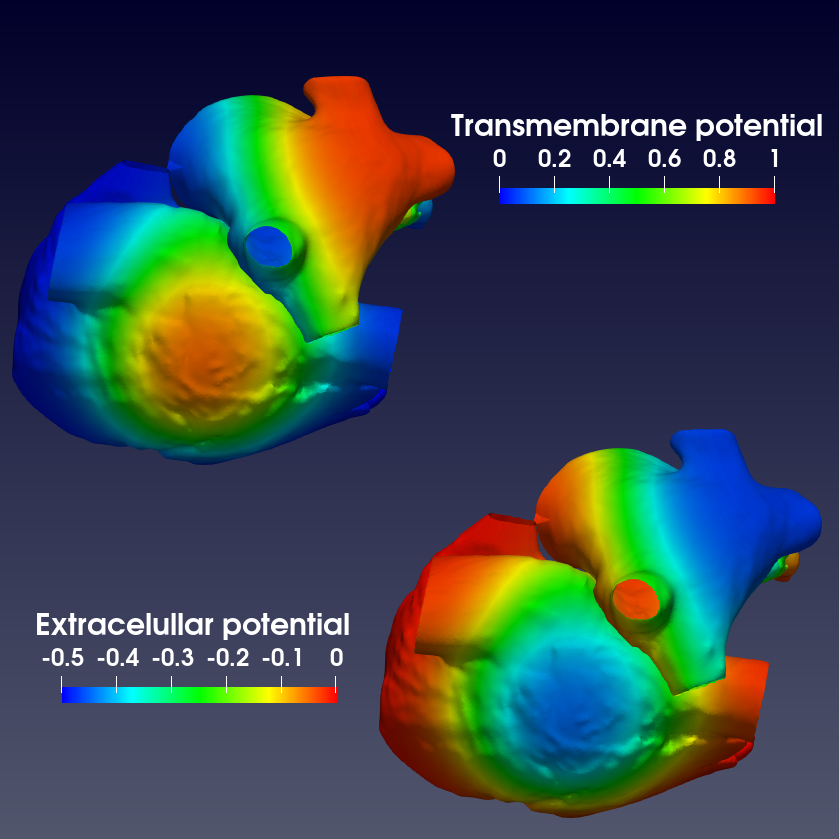
Beeler Reuter (1977) ionic model.
Here is an example of output you can get with this model.

![\[ \left\{\begin{array}{ll} \partial_t v + \dfrac{1}{C_\mathrm{m}}\left(I_\mathrm{ion}(v,w) + I_\mathrm{app}\right) - \dfrac{1}{A_\mathrm{m}C_\mathrm{m}}\nabla\cdot(\sigma_\mathrm{i}\nabla (v+u_\mathrm{e})) = 0 & \text{on }\Omega,\\ - \dfrac{1}{A_\mathrm{m}C_\mathrm{m}}\left[\nabla\cdot(\sigma_\mathrm{i}\nabla v) + \nabla\cdot((\sigma_\mathrm{i}+\sigma_\mathrm{e})\nabla u_\mathrm{e})\right] = 0 & \text{on }\Omega,\\[+5pt] \partial_t w + g(v,w) = 0 &\text{on }\Omega,\\ \sigma_\mathrm{i}\partial_{\bm{n}} (v+u_\mathrm{e}) = 0&\text{on }\partial\Omega,\\ + \text{ boundary conditions for }u_\mathrm{e},\\ + \text{ initial conditions.} \end{array}\right. \]](form_39.svg)


 is the surface to volume ratio of cell membranes, in
  ,
, is the cell membrane surfacic capacitance, in
  ,
, the tensorial intracellular conductivity, in
  . Usually, the tensor is the same everywhere when expressed in the local frame defined by fiber orientation. However, alterations of the tissue conductivity can be introduced by using volume fraction.
 the tensorial extracellular conductivity, in
 is the current due to ionic gates, in
  ,
, is the user-defined applied current used to stimulate a specific region of the domain,
 is the evolution function of ionic variables.